
Ever worry about your investments slipping away when unexpected things happen? Portfolio at risk shows you how much your loans or assets might fall in value if plans take a wrong turn. Think of it like tending a garden, you check if your plants need extra water during a dry spell.
In this article, we'll walk you through key financial warning signs so you can easily spot risky spots. Have you ever noticed how a little bit of extra attention now can help protect you later? Let's dive in together and learn how understanding portfolio at risk can pave the way for smarter, safer financial choices.
Defining Portfolio at Risk: Core Meaning and Context

Portfolio at risk is all about the chance that a group of loans or investments might lose value or not perform as well as expected. Think of it like a garden where some plants might not bloom as beautifully due to unexpected weather changes. It means the portfolio might take a hit from events like market changes, customers not paying back loans, shifts in interest rates, fraud, or even sudden changes in currency value.
Imagine you lend money to a group of people and then a few of them start missing payments; this is a common example of portfolio at risk in the banking world. Or picture a shaky stock market where investments lose steam – that’s another way to see it. By understanding these risks, decision-makers can know when to tighten their belts and adjust their strategies, much like spotting early signs that a garden needs extra watering before the drought hits.
Portfolio at risk meaning: Bright Financial Clarity

When banks assess risk, it's a bit like checking a portfolio's pulse. Think of each risk as a little red flag that helps you figure out how much credit exposure you have and gives you clues about default potential. Every risk tells a part of the financial story.
Here are eight main types of risk that can affect both lending and investing:
- Market Risk: This is the wobble you feel when inflation, global events, or economic cycles shift quickly, changing asset values in a flash.
- Credit Risk: This risk shows up when borrowers or bond issuers don’t pay back as promised, which can lower the portfolio’s value.
- Liquidity Risk: This happens when you can’t sell your assets fast without taking a hit on price, meaning cash might not be as available as you'd like.
- Inflation Risk: Here, rising prices make your returns worth a bit less over time, slowly eating away at what you earn.
- Currency Risk: When exchange rates bounce around, the returns on your international investments may change without much warning.
- Reinvestment Risk: This is the challenge you face in finding equally good rates to reinvest your cash flows, which can drag down overall performance.
- Concentration Risk: When your investments are too focused on one area or sector, a downturn in that segment can mean bigger losses.
- Political Risk: Sudden shifts in government policy or political unrest can shake up the economic environment and dampen portfolio gains.
Calculation Methods for Portfolio at Risk: Formulas and Metrics

Measuring your portfolio's risk is like checking the weather for your investment garden. You turn raw numbers into hints about what might come your way. Think of Standard Deviation as a tool that shows how much your portfolio might sway, like imagining gusts of wind that can scatter seeds in your garden.
Value at Risk, or VaR, estimates how much you could lose over a specific period at a certain confidence level. It’s a lot like planning for the worst heavy downpour so you know when to seek shelter. Then there’s Conditional VaR (CVaR), which steps in to give you an idea of the expected loss if things get even worse than that worst-case scenario.
The Sharpe Ratio is another handy tool. It compares the extra rewards of your portfolio to a risk-free return while taking overall volatility into account. Picture it as weighing the sweetness of a ripe fruit against the prickles of a cactus. And when it comes to credit, the PAR formula looks at the total past due loans compared to the whole portfolio. It tells you what portion of your loans might be dipping into risky territory.
When you set up your spreadsheet or risk management tool, these formulas become your guide. They help take all your raw data and turn it into a clear picture of where your risks lie. Every calculation is like a little checkpoint, helping you decide when to give your portfolio a boost or shield it from an impending storm.
| Metric Name | Formula | Key Input | Risk Insight |
|---|---|---|---|
| Standard Deviation | N/A | Portfolio returns | Shows overall volatility |
| VaR | N/A | Confidence level | Estimates potential loss |
| CVaR | N/A | VaR threshold | Computes expected loss beyond VaR |
| Sharpe Ratio | (Portfolio Return – Risk-Free Rate) ÷ Standard Deviation | Return rates | Measures return per unit of risk |
| PAR Formula | Sum of outstanding principals past due ÷ Total portfolio principal | Loan data | Gives insight into credit risk |
Interpreting Portfolio at Risk: Thresholds and Benchmarks
When you check your portfolio, it's a bit like watching a car's dashboard. You want to see clear signals about how everything is running. One of the main signals we look at is the portfolio at risk, or PAR, which shows us how many loans are overdue.
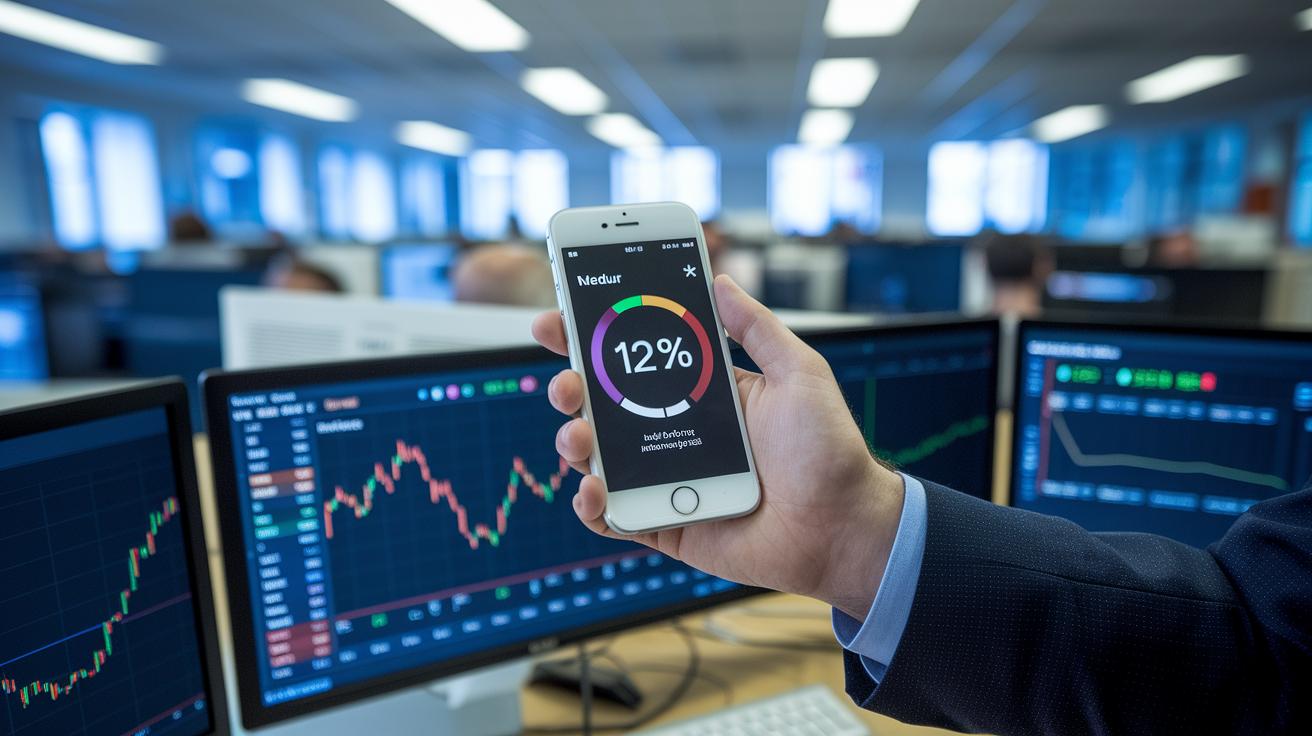
If less than 5% of the loans are past due, things are generally running smoothly. When the past-due percentage climbs between 5% and 10%, it's a nudge to be a bit more cautious. And if more than 10% of the loans are overdue, that’s a clear sign that the risk is high, like a red light flashing on your dashboard. For instance, if you spot that 12% of a bank’s loans are overdue, it’s time to take stronger control measures.
Another useful way to understand risk is by looking at the number of days past due. Usually, you’ll see categories like 30, 60, or even 90+ days. Think of it as checking how hot something is getting, the longer a loan goes unpaid, the bigger the problem.
It also helps to compare these numbers to industry averages or similar portfolios. Banks often set up internal rules with specific limits and alerts so that when these boundaries are crossed, they know it’s time to act.
- Risk bands help you gauge the overall health of the portfolio.
- Days past due show just how deep the problem might be.
- Benchmarking against others gives you a clearer picture of when to step in.
By keeping these points in mind, you can better steer your portfolio toward safer financial waters.
Applying Portfolio at Risk in Credit and Investment Portfolios

Using Portfolio at Risk, or PAR, helps guide smart, everyday decisions when it comes to your money. In microfinance, if you see a PAR reading above 10%, it’s a signal to step in and make some changes. You might start by tightening credit scoring or setting aside extra funds just in case losses occur. Banks rely on the same idea. They watch their PAR numbers to decide if they should adjust how much they hold in loan loss reserves or change their lending rules, kind of like checking your car’s dashboard for warning lights before a trip.
On the investment side, a high PAR during choppy market times often nudges investors to rebalance their portfolios. You might shift funds to steadier, low-volatility assets to better manage risk. While a riskier portfolio can sometimes mean higher returns, it also exposes you to big drops that can hurt your finances. Keeping a close eye on PAR lets you adjust your investments on the fly, ensuring your portfolio always matches your comfort level with risk.
| Sector | Action Taken |
|---|---|
| Microfinance | PAR above 10% prompts stricter credit measures. |
| Banking | PAR data is used to adjust loss reserves and improve lending criteria. |
| Investment | High PAR often signals moving funds to more stable assets. |
In short, watching PAR closely and making timely adjustments creates a strong, resilient financial setup. It's like having a friendly dashboard for your money, always keeping you ready to steer your financial journey safely.
Best Practices for Monitoring and Managing Portfolio at Risk

Start by making it a habit to check your portfolio risk regularly, just like you check your car’s dashboard for warning lights. Doing this every month or quarter helps you catch problems early before they get out of hand.
It’s a good idea to look at your risk numbers together with your nonperforming loan ratio. When both of these start to rise slowly, it might be a signal that you need to make lending rules a bit tighter.
You can make this process easier by automating data collection with familiar tools like Excel or business intelligence software. Think of it like setting up an alarm that rings when important risk measures move out of line.
Here are some simple tips:
- Review portfolio risk on a regular basis.
- Mix in nonperforming loan ratios to get the full picture.
- Use user-friendly tools to automate gathering your data.
- Keep an eye on big economic signs like interest rates and GDP growth.
- Once a year, check your risk thresholds and update your policies.
- Run stress tests and scenario analyses to see how risk levels might shift.
Using these approaches is like tuning a well-oiled machine, you’ll be ready to adjust your risk strategy before any small issues become big problems.
Final Words
In the action, this article broke down the portfolio at risk meaning by defining its role in measuring credit and investment risks. It walked through the risks, from market and credit to liquidity, and showed how formulas like VaR and the PAR formula guide risk assessment. Key thresholds and monitoring techniques were explained in simple, practical terms, offering clear insights for managing risk in everyday financial decisions. Overall, these insights help build confidence and set you on a path toward long-term financial success.
FAQ
What do you mean by portfolio at risk?
The term portfolio at risk means the portion of a credit or investment portfolio that is likely to produce losses due to overdue or underperforming assets, reflecting overall risk exposure.
What is the portfolio at risk formula?
The portfolio at risk formula calculates risk by dividing the outstanding principal on loans that are past due by the total portfolio principal, yielding a risk ratio for monitoring credit quality.
What does the portfolio at risk ratio indicate in banking and business?
The portfolio at risk ratio indicates how much of a lending or investment portfolio consists of overdue assets, serving as an essential metric to evaluate credit performance and financial health.
What is an example of portfolio at risk for 30 and 90 days?
For example, a 30-day overdue portfolio may represent lower risk, while a 90-day overdue portfolio signals heightened risk, prompting stricter credit controls and closer review.
What does PaR mean in microfinance?
In microfinance, PaR refers to the percentage of small loans that are past due, helping lenders assess performance and adjust credit policies to protect against potential losses.
What does a portfolio at risk greater than 30 days imply?
A portfolio at risk greater than 30 days implies that a significant portion of loans are overdue by more than a month, indicating increased credit risk and a need for proactive management.
How does understanding portfolio at risk help with financial risk management?
Understanding portfolio at risk aids financial risk management by helping assess asset performance, set actionable thresholds, and implement strategies to minimize losses.