
Ever wondered if a look at data trends could spark your next market move? Commodity market analytics takes old price patterns and today’s updates and turns them into clear, simple clues. It’s like flipping through a photo album that reveals secret hints about global trade. With easy-to-understand numbers and expert insights, you gain the confidence to navigate an unpredictable market. In today’s fast-changing world, every single data point matters.
How Commodity Analytics Powers Data-Driven Market Insights
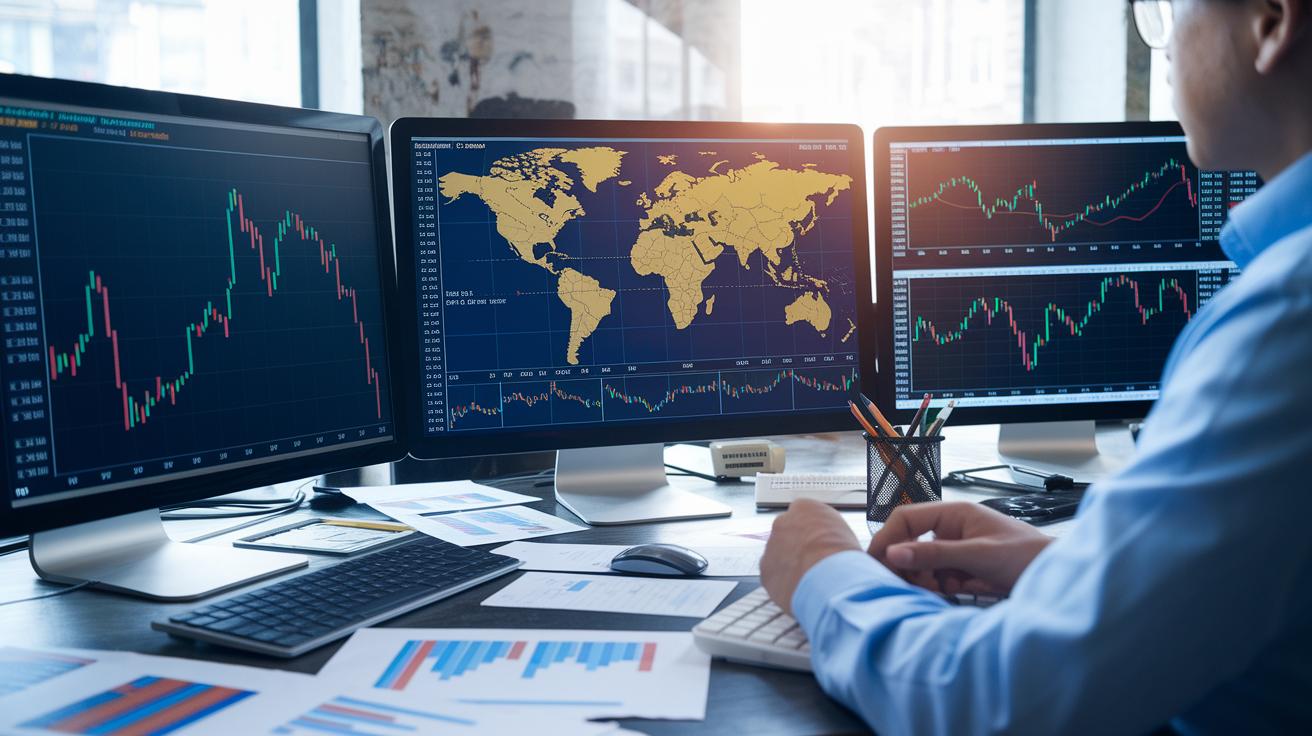
Commodity market analytics is like the foundation for making smart decisions in today’s busy markets. It helps you sort out all the facts and figures, especially when sudden changes in supply, political unrest, or even a rough patch of bad weather shake things up. Think of it as looking back at old photos to see how things like wheat prices slowly changed over time because of shifts in global trade. Ever wondered how tracking years of price trends might help spot a sudden spike from an unexpected storm?
Real-time monitoring takes that insight a step further by watching what’s happening right now. By looking at current events, local news, and up-to-date weather reports, traders can quickly catch shifts that might otherwise slip by unnoticed. This approach mixes technical stats with simple indicators, giving you clear numbers on trade volumes and showing you the key moments when prices change.
Then there’s market sentiment evaluation, which adds a personal touch to cold numbers. Even if prices aren’t moving much, experts offer insights on support levels, giving you a friendly perspective on how the market feels. This mix of hard data and expert opinion paints a picture of global trade trends and helps predict what might come next.
| Analytics Component | Key Benefit |
|---|---|
| Historical Data Review | Helps you see long-term changes in supply and demand |
| Real-Time Monitoring | Shows immediate market moves and weather effects |
By blending these methods together, commodity analytics gives traders the confidence to make well-informed choices. It turns raw numbers into clear, actionable insights, helping you match your market moves with a smart, precise strategy.
Essential Analytical Tools and Techniques in Commodity Market Analytics
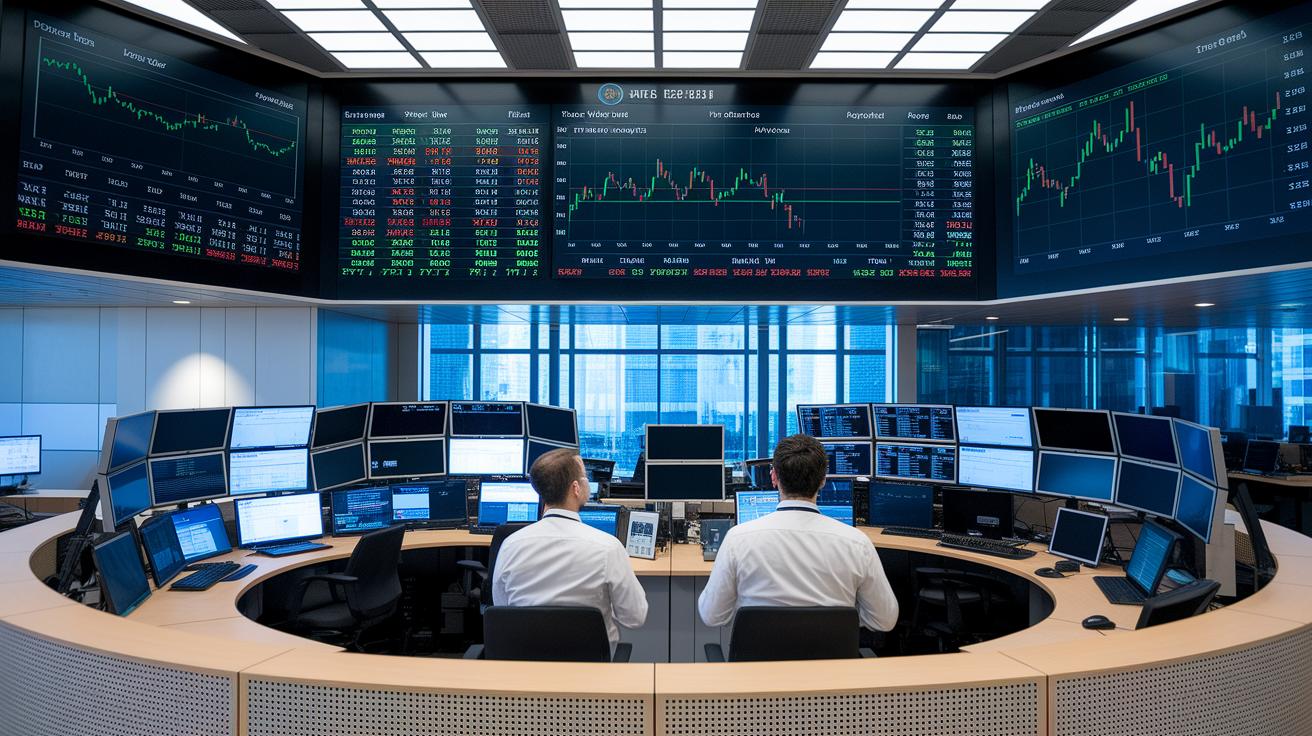
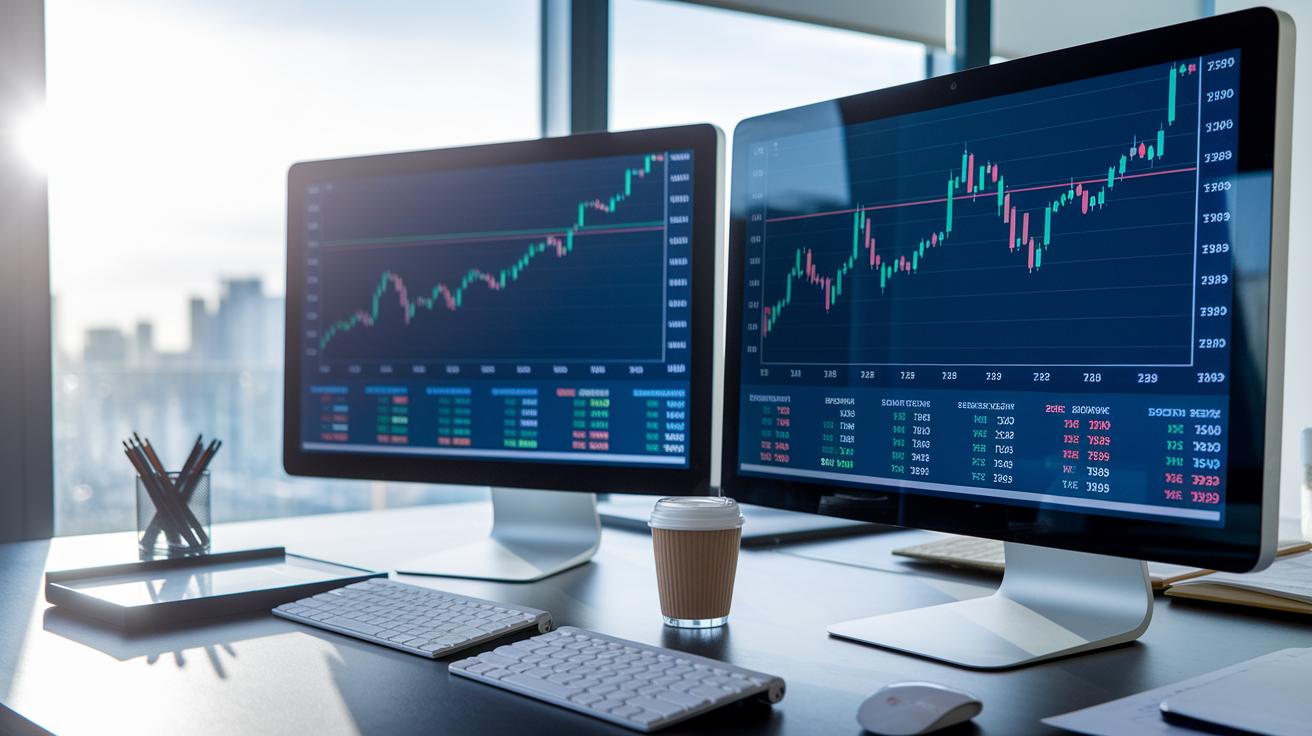
Live, interactive charts are the backbone of today's commodity market analysis. Picture a chart that updates right away when a trade goes down, much like watching your favorite game in real time. These charts show you commodities, indices, and futures so you can see market shifts as they happen.
Technical summaries give you extra clarity. Tools like pivot-point calculators, Fibonacci methods (a way to spread out price data so trends become clearer), and candlestick pattern recognition break down price moves into simple pieces. Think of it like dark clouds signaling an incoming storm.
Moving-average analysis is another useful trick. It smooths out the quick ups and downs, kind of like watching the steady rise of the tide instead of every little ripple. This method makes it easier to spot trends that last.
Advanced dashboards take this a step further by mixing charts, numbers, and clear visuals. They offer a close look at supply chain details and logistics trends, showing you how products move and what might disrupt them. They also use exogenous factor analysis, which means turning extra background info like weather changes or global events into clear market insights.
In short, these tools turn heaps of data into clear, practical snapshots that help traders and investors make smart decisions in our fast-changing global market.
Forecasting Price Trends with Predictive Modelling and Algorithms
Predictive modelling in commodity markets is like using a smart tool that blends both old data and fresh numbers to get a feel for where prices might go. Machine learning teams up with classic statistical methods to look at historical prices, global demand, and even big-picture clues about the economy. Think of it like a car dashboard that shows you past speeds and current traffic to help you guess your arrival time.
Trend prediction algorithms are tuned with care so they can adjust for seasonal ups and downs or shocks from unexpected events. For example, if prices typically rise in the winter or dip after a major event, the model catches on and shifts its view, much like knowing that a certain plant blooms in the spring helps you plan your garden.
Futures contract forecasting adds yet another layer. Traders dive into metrics like term-structure analysis and volatility clustering, which basically means they use today’s data to peek at the possible future value of contracts. Imagine it as piecing together snapshots of a game to guess the final score.
Statistical forecasting techniques mix simple math with more advanced methods to fine-tune these predictions. Calibrating a forecasting model is a bit like tuning a guitar, where each string needs to sound just right. When these elements come together, predictive modelling paints a clear picture of potential price trends and gives traders the insight they need to tweak their strategies in real time.
Managing Risk and Detecting Volatility in Commodity Markets

Commodity analytics uses clever, data-based methods that help spot early signs of sneaky market changes. Think of it like checking the weather before a storm, you look for small shifts in prices that might hint at a coming dip or sudden spike. Factor models help by looking closely at price changes, checking for groups of similar movements, and running simple stress tests. This is like watching for clouds gathering before a rain shower.
Risk management is all about having the right tools to keep your market exposure in check. One popular way to do this is by using techniques that rely on predictive analytics. These look at past patterns and today's conditions to pick out any weak spots early on. When new policies or regulations come into play, they can change how trade flows, much like a gust of wind might shift a sail. This evaluation helps traders prepare for any unexpected bumps ahead.
Another helpful tool is risk-return analysis. It’s a bit like planning a balanced meal: if one part isn’t as tasty, the overall dish can still be enjoyable because other ingredients cover for it. In the world of commodities, mixing different types of investments spreads out the risk, so a hard time in one area doesn’t ruin the whole picture.
Finally, keeping an eye on volatility factors is key. This means continually checking how different parts of the market interact, imagine sounding out the hum of a busy engine. By weaving all these ideas together, traders can fine-tune their strategies. They balance quick fixes with long-term plans, creating a playbook that’s ready for anything the market might throw their way.
Sector-Specific Analysis in Energy, Metals, and Agriculture
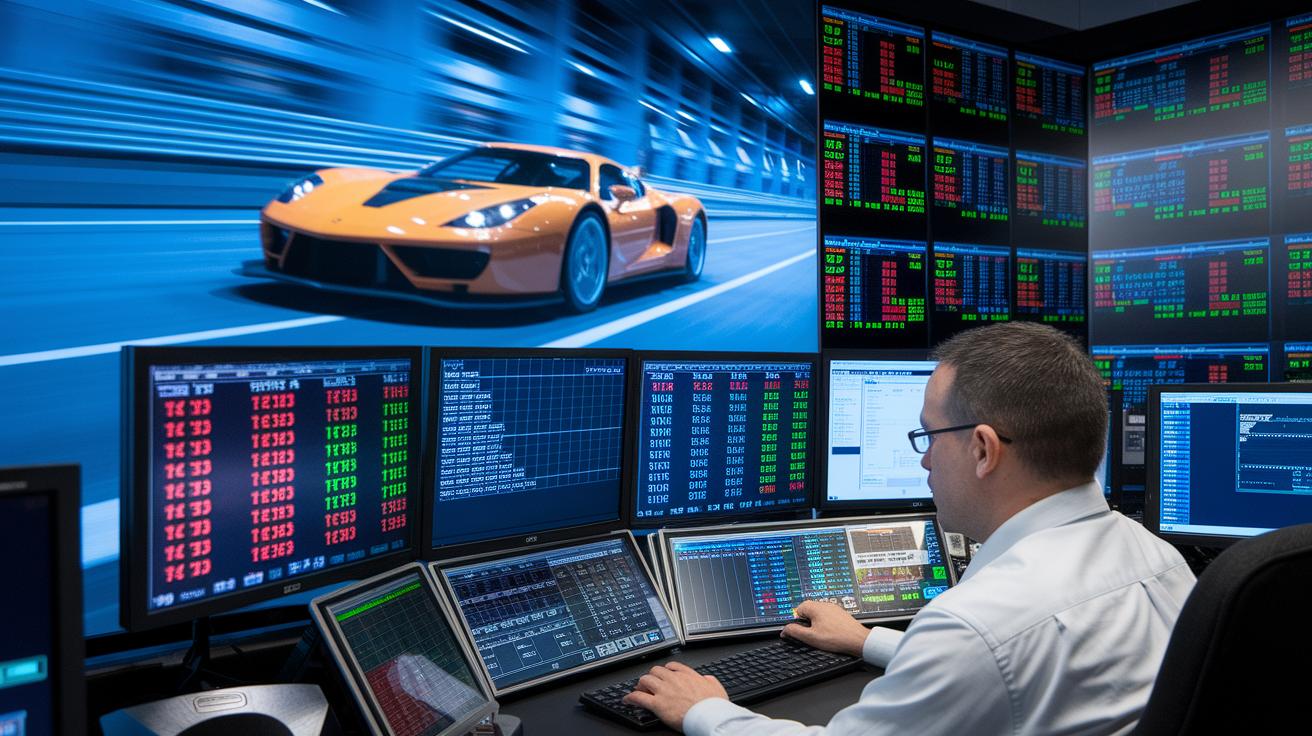
When we talk about monitoring energy commodities like crude oil WTI, Brent oil, and natural gas, it’s a bit like watching a live sports scoreboard. Traders check charts that update every minute, showing real-time liquidity and price changes. Imagine a ticker where every tick reflects how quickly world events can impact market values, kind of like watching a race car zoom by.
For metals such as gold, copper, and aluminum, pricing is all about using trusted indices. Think of these indices as a reliable dashboard in a cockpit that helps you see market trends and set pricing benchmarks. For instance, insights from the world gold council give you a peek into how these precious metals move in value. This kind of data gives investors a clearer picture, especially when markets are shifting fast.
When it comes to agricultural yields, farmers and traders use models based on US wheat data and crop forecasts. They mix weather reports with past trends to predict harvest sizes. It’s similar to checking a weather app before heading out for a picnic. With this approach, everyone gets a better idea of what to expect from the season’s crops.
Then there’s the appraisal of mineral resources. Here, keeping an eye on inventory levels and raw material supplies is key. Looking at these details shows how factors like seasonal weather or new production reports can change the availability and cost of raw materials. Each sector uses its own special metrics to turn complicated data into clear, everyday insights that help in making smart decisions.
Integrating Advanced Technology for Enhanced Commodity Market Analytics
Today’s platforms are changing how analysts understand commodity data. These systems mix big data and strong data integration to go through huge amounts of market and basic data every day. Think of it as a big digital toolkit that collects many bits of information and turns them into clear, easy-to-read insights.
AI tools like ChatGPT are now used to answer questions in everyday language and test out new models very quickly. You might ask, "What is pushing oil prices today?" and then receive a simple, clear answer. It’s like having a friendly money expert sitting nearby, ready to explain things in plain language.
At the same time, blockchain and IoT are helping to make supply chains more open and clear. Imagine watching a live map that shows exactly how products move from one spot to the next. This kind of view lets everyone work together in real time, so decisions are based on fresh and solid information.
Cloud-based systems also play a big role. They process data quickly and accurately, helping traders and investors make decisions without waiting for important details.
| Technology | Impact |
|---|---|
| AI Tools | Quick answers to questions and fast testing of new models |
| Blockchain & IoT | Better clarity and real-time sharing of information |
Applying Commodity Market Analytics in Trading and Investment Strategies
Analytics works like a friendly control center, lighting up to let traders know the best moments to enter or exit a trade. It takes in lots of data – from real-time market moves to the buzz on news sites and social channels – and turns it into simple signals that help shape smart hedging choices and build balanced portfolios.
Using facts from solid data can cut down on extra costs and keep supply chains running smoothly. Imagine a trader noticing a sudden dip in liquidity from performance checks; they can quickly shift their positions. This quick reaction not only cuts expenses but also helps them stay sharp in the market, like mixing just the right ingredients for a perfect recipe. Special algorithms then work to spread investments across different commodities so that one asset never takes over the whole mix.
Traders also lean on sentiment analysis to fine-tune their signals. News stories and social posts act like little hints that, when understood correctly, can warn of changes affecting compliance or hedging. These insights shine a light on any risks and help adjust portfolios to aim for the best returns.
Steps to check operational costs run throughout the process by keeping an eye on market performance and liquidity trends over time. This means decision makers get clear, evidence-based advice that not only helps with timing each trade but also keeps risk and reward in balance. Plus, ongoing checks make sure all strategies stick to the rules.
Key benefits include:
- Optimized supply chains with fewer delays
- Hedging strategies built on solid data
- Well-balanced portfolios with different assets
- Ongoing tracking of performance
- Quick adjustments using sentiment clues
- Built-in checks for regulatory compliance
Final Words
In the action, the blog outlined how historical data review, real-time monitoring, and predictive models power clear market insights. It described practical tools like live charts and technical indicators paired with sentiment evaluation to guide trading and risk management. Short discussions on sector-specific analysis and advanced technology further illustrated how these methods work together. When you apply these strategies, commodity market analytics becomes the catalyst for confident financial decisions and thoughtful investment moves. This integrated approach paves a path to a more secure and informed financial future.
FAQ
Q: What does commodity market live mean?
A: Commodity market live shows real-time updates on prices and trading activity. It provides current snapshots that help you see market shifts as they happen, giving useful hints for quick trading decisions.
Q: What are the best commodity market analytics?
A: The best commodity market analytics blend live charts, historical data, and predictive models. They offer clear, quick insights into market trends that help you make smart trading decisions.
Q: What is commodity market analytics pdf?
A: Commodity market analytics pdf files offer detailed reports and visual data in a portable format. They make it easier to review trends, technical summaries, and historical price movements anytime.
Q: What is a commodity market analytics app?
A: A commodity market analytics app delivers interactive charts and data dashboards right on your device. It provides real-time updates and technical tools so you can quickly assess market changes.
Q: What does the World Bank Commodity Markets Outlook cover?
A: The World Bank Commodity Markets Outlook details forecasts, market trends, and supply-demand shifts. It gives a clear overview of global trade impacts and helps you understand future market moves.
Q: What is the commodity market outlook 2025?
A: The commodity market outlook 2025 reviews projected trends, expected price shifts, and market factors leading into 2025. It offers a preview of how supply and demand changes might influence prices.
Q: What do agricultural commodity prices today reflect?
A: Agricultural commodity prices today mirror current market conditions for crops and livestock. They reflect weather, seasonal patterns, and supply-demand changes that affect food pricing on the global market.
Q: What is commodity market analysis?
A: Commodity market analysis studies price trends, supply and demand, and external influences like weather and global events. It uses live data and historical charts to help guide wise trading decisions.
Q: Who are the big 4 commodity traders?
A: The big 4 commodity traders are the leading firms known for large trade volumes and market influence. Their activity often shapes price movements and overall market sentiment.
Q: Which is the best indicator for commodity trading?
A: The best indicator depends on your strategy, but many traders lean on moving-average analysis and live charts. These tools help identify clear signals about the best times to buy or sell.
Q: How do you analyze commodity prices?
A: You analyze commodity prices by reviewing historical data, live charts, and market sentiment. This method helps you track trends, assess shifts in supply and demand, and make informed predictions on price moves.