
Have you ever thought that a single number could change your trading game? The Mannarino Market Risk Indicator brings together a country’s debt, the strength of the dollar, and U.S. borrowing rates into one easy-to-read score.
Think of it like a friendly alert on your dashboard, when the market starts to shift, this tool gives you an early warning so you can adjust before surprises hit.
In this post, I'll explain how this indicator works and why it matters. It's a simple way to spot risks early, helping you feel more confident about your trading decisions.
Mannarino Market Risk Indicator: Empowering Smart Trading
The Mannarino Market Risk Indicator, or MMMRI, is a simple tool that helps you understand the overall risk in the market. It works by multiplying a country’s debt-to-GDP ratio (a basic way to see how much a country owes) by the strength of the dollar (based on a trusted currency index) and by the current US interest rate (which tells us about the cost of borrowing). Then, it divides that total by 1.61. The outcome is a single score that mixes together ideas about national debt, how strong the dollar is, and what the current rates are. If you’re curious what market risk really means, have a look at "What Is Market Risk" for a clear, simple explanation.
This tool really comes into its own when the markets seem uncertain. Think of it as your early warning system during times of economic instability, big changes, global events, or when central banks make announcements. When news about geopolitical tensions starts to surface, this indicator can help you see the shifts before they fully hit the market, thanks to its clear numerical signal. It’s a handy way for both careful, long-term investors and active traders to keep an eye on risk moves that other tools might miss.
Calculation Method for the Mannarino Market Risk Indicator

The Mannarino Market Risk Indicator uses a neat formula to give you a quick snapshot of market risk. It takes three key factors, the Debt-to-GDP ratio, the strength of the US dollar, and the US interest rate, and multiplies them together, before dividing by 1.61. The Debt-to-GDP ratio shows how heavy a country's debt is compared to its economic output. Meanwhile, the dollar’s strength is measured by a trusted index that tells us how the greenback is doing globally, and the US interest rate comes from the Fed funds rate, which hints at the cost for borrowing money. These figures, gathered from sources like IMF reports, Federal Reserve announcements, and reliable currency indices, blend together to form a clear and solid risk measure.
Think of it as mixing ingredients for a recipe; each component has its own flavor, and when combined with care, they create an indicator that’s easy to compute and even easier to understand. If you’re curious about how these broad economic factors come together, feel free to check out the Advanced Quantitative Analysis Methods for a deeper dive.
| Component | Role |
|---|---|
| Debt-to-GDP Ratio | Shows national financial leverage by comparing debt to economic output |
| USD Strength | Reflects the overall performance of the dollar using a trusted index |
| USD Interest Rate | Points to the borrowing cost, as indicated by the Fed funds rate |
| Division Factor (1.61) | Balances the combined inputs for a clear overall score |
Variable Definitions
Each part of the formula tells its own story. The Debt-to-GDP Ratio gives you a clear picture of a nation’s debt compared to its economic productivity, with details drawn from global financial reports. The strength of the US dollar is taken from an index that tracks its value against other key currencies, giving you an idea of its global clout. And the USD Interest Rate, noted from reliable Federal Reserve updates, shows the expense of borrowing money.
Formula Breakdown
Here’s how it works: the three inputs, debt, dollar strength, and interest rate, are multiplied together to capture different pressures in the market. Then, dividing the result by 1.61 turns all that information into one simple risk score. This step-by-step process helps break down complex economic data into an easy-to-understand number, so traders and analysts can quickly spot potential shifts in the market.
Interpreting Mannarino's Market Volatility Signals
One trader noticed that a small jump from 9 to 11 signaled the start of a busy trading day. The MMMRI gives you one simple number that you plot on real-time risk charts. When the number is below 10, think of it as calm weather; risk is low, and the market feels steady. If the number is between 10 and 20, it means risk is a bit higher and the market might be a little bumpy; it's like a gentle wind stirring up a few leaves. But if the reading climbs above 20, that's your cue for high risk, picture the sky darkening as a storm rolls in.
Traders keep a close eye on these live scores with a tracker system. Watching the charts is much like checking your car’s dashboard; a quick spike tells you that conditions are changing. This live insight guides traders on when to tweak their trades. They might adjust their stock bets or even change up their asset mix using tools like the Investment Portfolio Risk Management service. With this steady pulse on the market, they can quickly act to protect their positions when the financial weather turns rough.
Trading Strategies Leveraging the Mannarino Market Risk Indicator
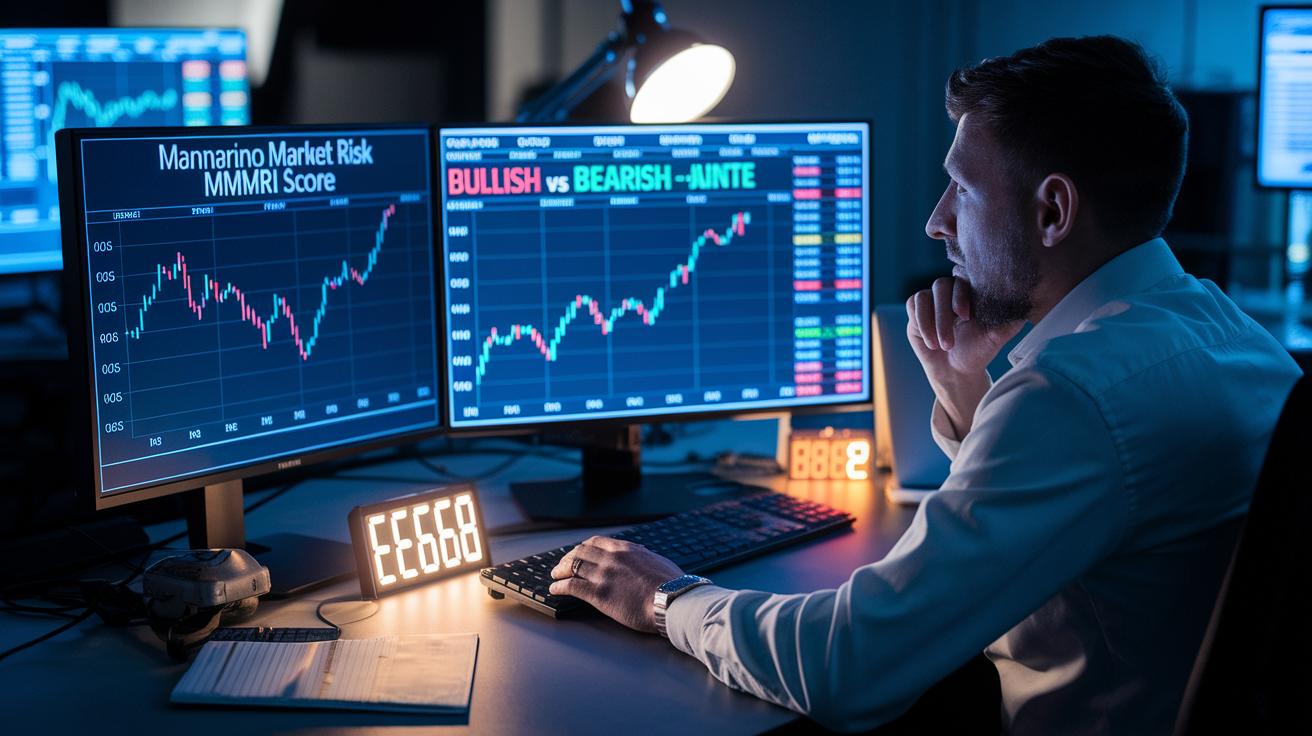
Traders count on the Mannarino Market Risk Indicator as a trusted sign when deciding on their next move. They often pair it with handy tools like the Bullish vs. Bearish Candle Counter and the Mins Before Market Close Alert. This single score helps them decide when to jump in or step out, figure out how big a position to take, and adjust stop-loss settings. Think of it as a quick market check that works well alongside other methods, offering a clear picture even when conditions shift.
Long-Term Investment Use
For those with a long game in mind, a low MMMRI can signal it might be a smart time to add more money to your stock mix. When the score is calm, it makes decisions easier, much like choosing the right ingredients for a family meal. Services like the Investment Portfolio Asset Allocation tool help you review your holdings, giving you the confidence to boost your exposure to stocks while keeping an eye on risk.
Short-Term Trading Use
On the other hand, when MMMRI shows high numbers, it can serve as a wake-up call for active traders. This signal is especially useful during quick market shifts, encouraging steps like hedging or parking cash in safer spots. The indicator quickly mirrors changes throughout the day, making it a reliable guide for managing short-term ups and downs. By weaving MMMRI into a broader strategy, traders can tackle both risks and opportunities with a balanced, informed approach.
Mannarino Market Risk Indicator Case Studies
Let's talk about two clear examples that show how useful the MMMRI can be for spotting market changes. In the first instance, back on February 19, 2020, the MMMRI shot up from 20 to 35 just before the S&P 500 dropped 30%. This sharp jump acted like a big red warning sign for traders, signaling that risks were quickly stacking up. Many experts took note and adjusted their strategies early, using the indicator as a tool to guard their investments against a looming downturn.
Now, consider the second case from the second quarter of 2021. Here, the MMMRI dipped below 15 during a calm period. Not long after, the market enjoyed an 8% gain over the quarter. Traders found that a low MMMRI reading often meant it was a good time to hold onto or even add to their positions. This calm indicator reading gave them the confidence to strengthen their investments while still keeping an eye on any potential risks.
Both examples offer practical insights on timing your trades smartly. By keeping tabs on the indicator's moves, traders can decide when to prepare for tough times or when it might be a good moment to seize new opportunities. The first example warned of an incoming storm, while the second showed a time of smoother sailing. In this way, the MMMRI serves as a straightforward and useful tool, helping balance caution with opportunity in an ever-changing market.
Final Words
In the action, we broke down the mannarino market risk indicator, explaining its formula and how it signals shifts in market conditions. We showed how values can hint at risk levels and guide both quick trading moves and long-term planning.
We tied real examples into strategies for confident, smart moves that match market moods. Keep these insights close as you plan ahead and watch your financial plans thrive.
FAQ
What is the Mannarino market risk indicator strategy?
The Mannarino market risk indicator strategy uses a score calculated from debt-to-GDP, USD strength, and interest rates to help guide entry, exit, and risk control strategies in trading.
Is the Mannarino market risk indicator available for free or as a free download?
The indicator is offered as a free download option, allowing traders to access market risk insights without an upfront cost before integrating it into their analysis.
What does the MMRI indicator mean?
The MMRI indicator stands for the Mannarino Market Risk Indicator, which measures market risk through a composite score combining the debt-to-GDP ratio, USD strength, and interest rate information.
What is MMRI Medical?
MMRI in the context of market risk is not related to medical applications; it strictly refers to the financial indicator developed to assess market risk during economic changes.
Who is Gregory Mannarino?
Gregory Mannarino is a financial analyst known for his market risk methods and trading insights, emphasizing the practical use of indicators like the MMRI for informed investment decisions.
What about Gregory Mannarino’s wife?
Personal details such as Gregory Mannarino’s wife are not a focus of his financial work; his expertise centers on market analysis and providing actionable trading strategies.
What is the purpose of the MMRI indicator?
The MMRI indicator is designed to measure market risk by combining key economic factors into a composite score that signals varying degrees of market volatility and potential risk.
How is market risk measured?
Market risk is measured by analyzing several macroeconomic factors such as debt-to-GDP ratios, USD strength, and interest rates; learn more about risk measurement in What Is Market Risk.
What is market risk?
Market risk represents the chance of financial loss due to market fluctuations from factors like economic changes, interest rate shifts, and currency movements that affect asset values.
What are the different types of market risk?
The different market risks include interest rate risk, equity risk, and currency risk, along with risks from economic events that can affect overall market stability.