
Have you ever wondered how some businesses always seem ready for what comes next? They tap into bright data, a tool that turns everyday numbers into clear, future-focused insights. Picture it like a steady heartbeat that tracks how we shop and live, revealing trends as they emerge.
In this post, we’ll chat about how real-time data helps businesses pick up on new ideas before the crowd catches on. It’s like having a smart edge that guides companies to plan carefully and quickly adjust when things change.
Market Trend Analytics for Strategic Decision-Making

Market trend analytics is all about spotting patterns in how people shop, what they like, and how the overall market moves. It collects information all the time so businesses can predict shifts and act ahead of the game. Instead of relying on a one-time look, this method keeps gathering fresh insights, which helps companies test new ideas and explore different regions.
This approach truly matters because it turns numbers into clear, practical advice. Have you ever wondered how changes in our economy or culture can affect your favorite products? Market trend analytics breaks it down for you, showing how various factors play a role in market moves. This way, companies are always ready to react quickly and jump on trends that others might miss.
- Gives real-time insight into what shoppers are doing
- Spots new patterns that hint at upcoming market changes
- Helps break down information by age, interests, or location
- Transforms raw numbers into smart decision-making tips
- Improves how resources are planned and used
When companies keep track of data all the time and sort it into key categories, they gain a clear picture of the marketplace. They consider things like economic changes and cultural trends, turning basic numbers into practical advice. This well-rounded view lets businesses act fast when needed and keep long-term plans on track. In the end, market trend analytics builds a strong foundation for growth and gives companies an edge by relying on the latest, most reliable information.
Key Predictive Models in Market Trend Analytics

Predictive models help us understand where the market might be headed by using past numbers, customer feelings, and economic facts. Think of it like checking the weather forecast using clues from yesterday. Businesses use these insights to spot trends early and get ready for change before it hits.
For example, methods like ARIMA and exponential smoothing look at time-based data to smooth out short-term bumps. Meanwhile, Monte Carlo simulation plays out different future scenarios to show what could happen. These approaches give teams the quick confidence they need to make smart decisions on the fly. If you're curious about how these models stack up, check out the Predictive vs Prescriptive Financial Analytics link.
| Model Type | Purpose | Key Data Inputs |
|---|---|---|
| ARIMA | Analyzing time trends | Past market data |
| Exponential Smoothing | Smoothing out short-term ups and downs | Time series info |
| Monte Carlo | Testing different future scenarios | Various simulation inputs |
| Machine Learning | Forecasting with many factors | History, customer sentiment, economic data |
Choosing the right model really depends on what you need and how ready your data is. If you want a detailed look at trends over time, ARIMA or exponential smoothing might be just right. For exploring different possible outcomes, Monte Carlo simulation offers valuable insights. And when you have lots of mixed data, machine learning can pull it all together for you. Matching a model to your goals helps turn predictions into clear, practical actions.
Market Trend Analytics: Bright Data Sparks Growth
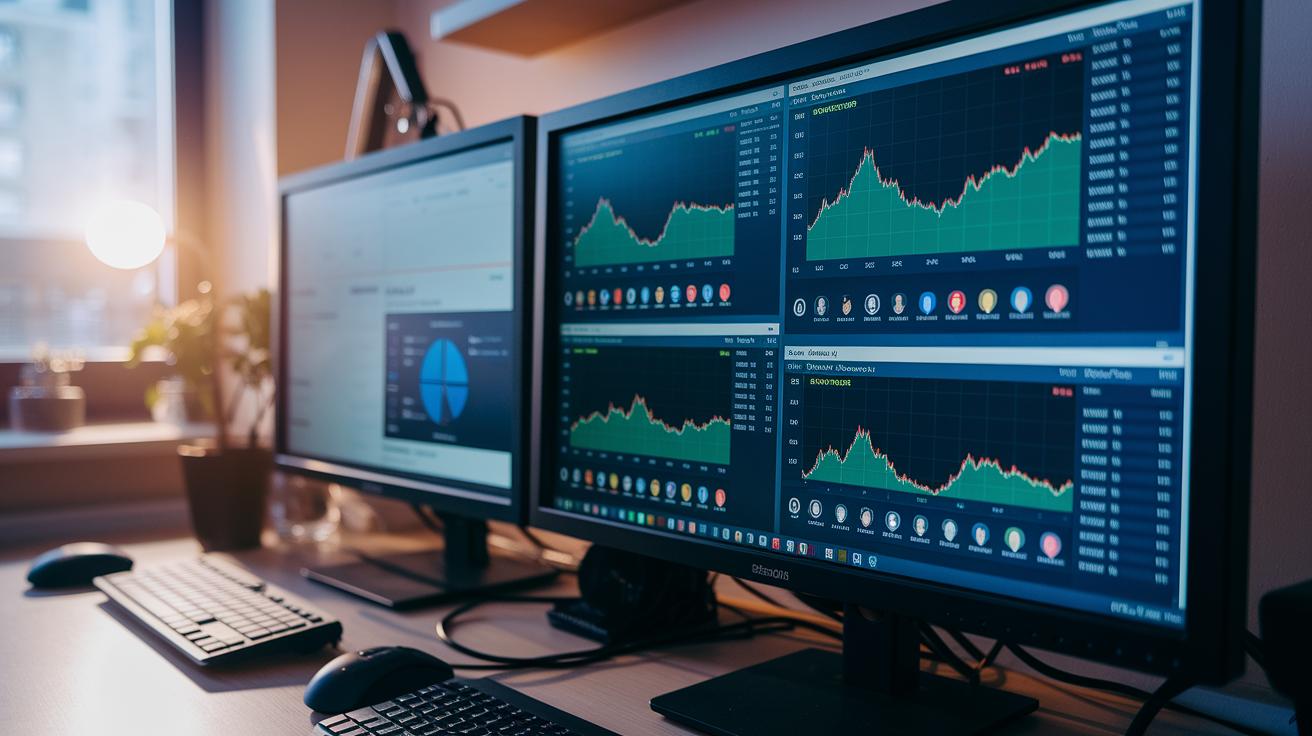
Imagine having a dashboard that updates in real time with data that shows you exactly what customers are thinking, what they're searching for, and even how your competitors are doing. Instead of waiting until the end of the month for a summary, live data lets you spot trends and sudden shifts as they happen. It’s like watching the market in real time and turning a flood of numbers into clear, easy-to-understand insights.
Picture this: you're gathering customer feedback through online surveys, tracking search trends with web tools, and keeping an eye on competitor activities all at once. These live updates serve as your secret ingredients, signaling when something unexpected occurs. It means you can quickly see which areas might need a change or a closer look.
When you get this kind of instant data, you can take action on the spot. Teams can adjust their plans or move resources around in just a blink to seize short-term opportunities. This fast response gives your business a solid advantage in markets that are always on the move.
Evaluating Data Visualization Methods for Market Trend Analytics
Static charts, like line and bar graphs, are a bit like photos that capture a moment in time. They show time series data clearly so you can notice trends quickly. They work best when you want a fixed picture of performance over a certain period. On the other hand, tools like heat maps (color-coded visuals that spotlight different segments) or candlestick diagrams (charts that show the highs, lows, and price movements in trading) can reveal more details. Still, without interactive features, even these visuals can feel a bit one-dimensional for the fast-paced needs of modern businesses.
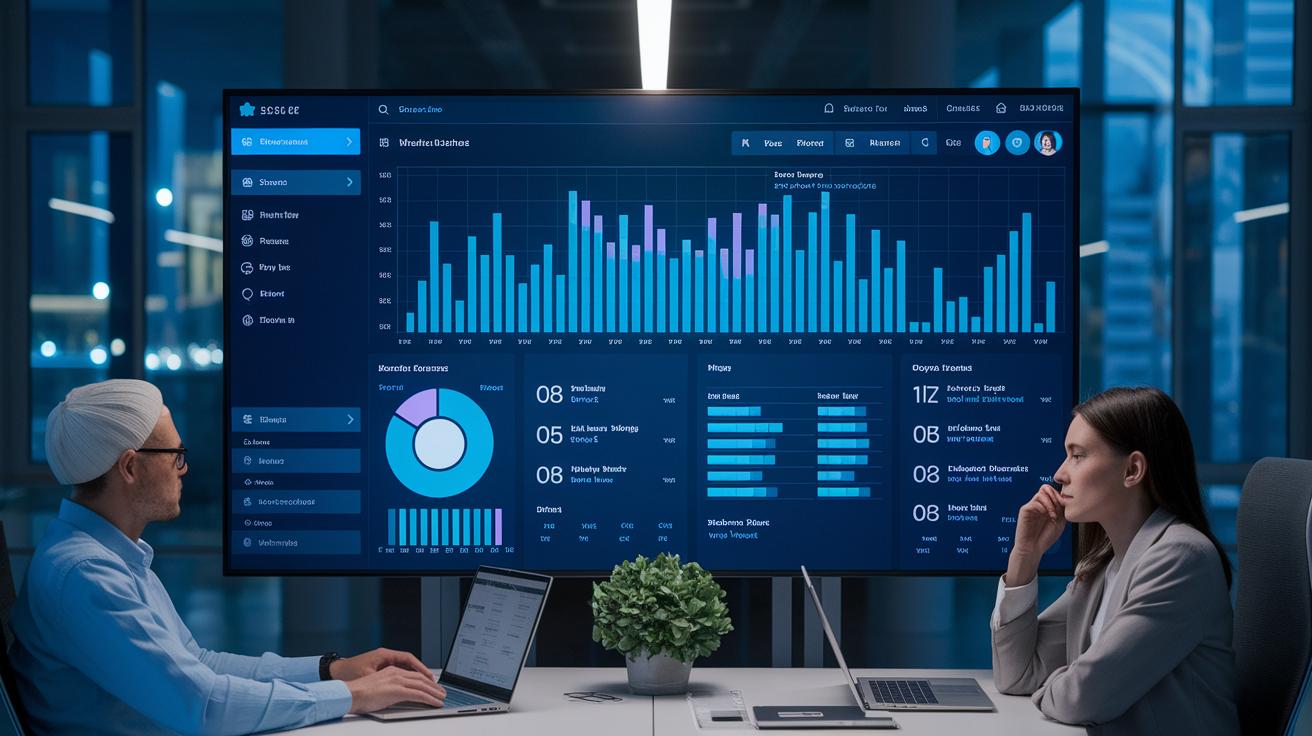
Interactive dashboards, however, turn up the volume when it comes to data insight. They let you customize what you see, update in real time, and explore details more deeply. Imagine blending the straightforward clarity of traditional charts with the ability to dig into the numbers, this shift helps you spot emerging patterns and surprises right away, making decision-making quicker and easier.
Designing Interactive Dashboards
A well-designed dashboard usually starts with features like custom filters. These let you tailor your view by factors such as demographics or regions, almost like adjusting the lens on a camera. You can even click through a big trend to zoom in on the smaller details, giving you a layered, clear picture of the whole story.
Keeping your dashboard updated is key. Real-time refresh rates ensure that you're always looking at the most current numbers. Combine this with a clean layout, intuitive controls, and clear visual hints, and you have a tool that transforms raw data into actionable insights that can really drive growth.
Chart Pattern Analysis and Quantitative Models in Market Trend Analytics

When you look at common shapes in market charts, like head-and-shoulders, double tops, or triangles, they can hint if the trend might change or continue. It’s a bit like spotting a familiar shape in the clouds that tells you a shift could be coming. For example, a head-and-shoulders pattern acts like a caution sign, hinting that a steady rise might soon turn. These clues help turn raw numbers into useful tips for making smart business moves.
Volume-based work is also key in checking these patterns. By looking at today’s trading volume and comparing it with past numbers, experts can decide if what they see is solid or just a small, random spike. Think of it like listening to a drumbeat, if it starts to grow louder, you know a big moment might be on its way. For more details on this process, check out “Volume Analysis in Technical Analysis.” This extra step helps turn a simple visual clue into a fuller understanding.
More advanced models mix in things like market mood, economic signals, and technical data. These models give you a bigger picture by pulling in many different signals at once. It’s like watching a well-tended garden where every element works together to tell you why a trend is happening. By scanning these multiple factors automatically, the system fine-tunes its predictions and helps decide how strong and long a market move might be.
Applying Advanced Trend Insights in Market Trend Analytics to Investment Decisions

Advanced trend insights are shaking up how businesses fine-tune their competitive strategies. Companies these days use real-time data not just to improve their products and marketing but also to smartly distribute resources across their portfolios. Imagine a retailer who tweaks their inventory mix as soon as trending data hints at a shift in what customers want, or a tech firm that ups its investment in new software based on clear signs from consumer feedback. Every part of the business, from research and development to sales, gets a boost by grounding decisions in solid, up-to-date data.
It’s like having a friendly guide that helps you stay a step ahead. Companies blend high-tech scanning tools with investor insight analytics to notice market changes early on. Tools that gauge investor sentiment give you a peek at risks and opportunities that might just slip under the radar. Picture overlaying nonstop trend tracking onto your long-range plans so you can adjust your strategy quickly when something new pops up. Bringing these insights into strategy meetings and regular reports turns raw data into clear, actionable steps for everyone in the business.
The rewards are clear. Firms that lean into these advanced insights enjoy stronger investment portfolios and better returns because they act fast on market cues. This proactive approach not only helps fix small issues as they emerge but also strengthens the overall direction of the company. It’s like fine-tuning a car engine, you get smoother performance and greater confidence that all parts will work well together over the long haul.
Final Words
In the action of market trend analytics, we explored how smart data gathering and easy-to-read visuals guide financial strategy. We broke down the use of predictive models, live reporting dashboards, and detailed chart analysis that bring clarity to market patterns.
Small shifts in continuous data, segmentation, and context create practical strategies that boost financial confidence while sharpening decision-making skills. Embrace these insights with optimism, each step builds a clearer path toward long-term success.
FAQ
What is a market trend analysis?
The market trend analysis identifies patterns in consumer behavior and market shifts by continuously gathering data, which helps businesses forecast changes and adjust strategies.
What are some examples of market trend analytics?
The market trend analytics examples include tracking customer purchase behavior and regional sales changes, which reveal hidden drivers in market activity and support proactive decision-making.
What are some popular market trend analytics tools and resources?
The market trend analytics tools incorporate specialized software, live dashboards, and downloadable reports in PDF format. These resources provide continuous data and visual insights to support timely decisions.
How to check market trends?
The market trend-checking process involves reviewing real-time dashboards, industry reports, and consumer sentiment data, enabling businesses to quickly spot emerging patterns and adjust their strategies.
Can ChatGPT do trend analysis?
The use of ChatGPT for trend analysis means leveraging AI to summarize available data and offer initial insights, though specialized tools may be needed for detailed, real-time evaluations.
What are the 4 C’s of marketing analysis?
The 4 C’s of marketing analysis refer to Customer, Company, Competitors, and Context. This framework helps businesses assess market conditions, align strategies, and manage their competitive environment.