
Have you ever wondered if waiting for slow updates might risk your trades? Outdated systems can miss sudden shifts in the market, leaving you unprepared.
Real-time risk monitoring gives you instant alerts, much like a friend who keeps a careful watch around the clock. This way, you can act swiftly and confidently whenever the market changes.
In this post, we explore how live tracking can boost your confidence and help you stay ahead in a fast-moving market.
Real-Time Market Risk Monitoring Framework
Imagine keeping a constant eye on your market data and portfolio performance, so you can notice shifts in risk as soon as they happen. Instead of waiting for an update at scheduled times, this method gives you instant feedback on market moves, ensuring you always have the latest information to make smart decisions.
Old systems often counted on updates happening only at set times, which could mean missing out on quick opportunities or letting losses build up before you even noticed. In today's fast-moving trading world, it’s like switching from a candlelit room to bright LED lights, you see everything in real time. Modern systems now use streaming technology that processes data right away, meaning that you can react to changes as they occur.
With streaming data, the system picks up live events and rechecks risk levels every moment. This continuous check-up is essential because it helps you keep tabs on risks while you navigate the ups and downs of the market. When trades are happening in the blink of an eye, having a tool that instantly monitors and recalculates risk is like having a trusty co-pilot keeping your portfolio stable and your confidence high.
Key parts of a strong real-time market risk system include:
| Component | Description |
|---|---|
| Data Integration | Collecting and combining information from different sources to get a full picture |
| Risk Metrics | Calculating important numbers that tell you about potential risks |
| Event-Driven Processing | Reacting to every market move as it happens |
| Alerting Mechanisms | Notifying you immediately when something needs attention |
| Distributed Computing | Using multiple computers to process data quickly and efficiently |
When you combine these elements, you build a strong system that is always on its toes about risk. It automatically recalculates important figures like Value-at-Risk (VaR – a way to measure how much you might lose) and drawdown, so you never cross a risk threshold without knowing about it. By blending real-time data with powerful computing, you get the timely alerts and insights you need to boost your trading confidence and keep your portfolio secure.
Advanced Data Integration for Real-Time Market Risk Monitoring

Switching from batch processing to live streaming is a real game changer. Old systems built on data lakes and Hadoop often deliver risk numbers that are outdated. Today’s technology pulls in fresh pricing, volume, and volatility data from many exchanges. This continuous flow lets trading systems calculate risk almost instantly, giving traders the current insights they need to stay nimble.
Event-Driven Data Streaming Architecture
At the heart of this breakthrough is an event-driven data streaming setup. Producers send out live market events to brokers, who then pass the data along. Consumers pick up the stream, and processing nodes work quickly to update risk metrics. This method cuts down delays and makes sure every tick of market data is handled right away. It really helps bridge the gap between tracking market ups and downs and taking swift action on risk management.
Technologies like Apache Kafka and Confluent support both small batches and event-driven analytics, making speedy data integration possible. Integration tools, such as Java paired with GigaSpaces, help spread out data ingestion and risk calculations across different systems. When combined with financial APIs, these tools form a solid backbone that keeps market risk monitoring both efficient and responsive.
Real-Time Risk Assessment Methodologies and Metrics
When you manage a portfolio, everyday market shifts can be as quick as a blink. That's why updating your risk measures continuously is key. Keeping these numbers fresh helps you understand how much risk you're sitting on. By relying on simple, quantitative risk models, you can keep an eye on risk tools and tweak your strategy on the fly when conditions change.
| Metric | Definition | Purpose |
|---|---|---|
| VaR | Gives an estimate of the worst loss you might face over a set period at a certain confidence level. (For example, a 95% VaR means there’s a 5% chance you could lose more than expected.) | Helps you see how much value might drop. |
| Drawdown | Shows the drop from the highest point to the lowest in your portfolio’s value. | Points out times when losses get big. |
| Liquidity Risk | Checks the difference between buying and selling prices to make sure you have a safe exit. | Keeps you confident that you can sell your assets without driving prices down. |
| Volume Anomaly | Catches unexpected changes in trading volume. | Helps spot potential issues in trading or system glitches. |
| Stress Testing | Runs quick scenario tests by adjusting factors like interest rates or market volatility. | Shows how your portfolio might handle extreme market moves. |
These measures connect directly with alert systems that let traders know when risks go beyond set limits. With real-time risk checks, these systems can immediately call for a change – like shifting holdings or rebalancing the portfolio – before things slip out of control. This hands-on approach keeps you monitoring continuously and making quick decisions, so you can trade with confidence even when markets get wild.
Real-Time Risk Dashboards and Automated Alert Systems
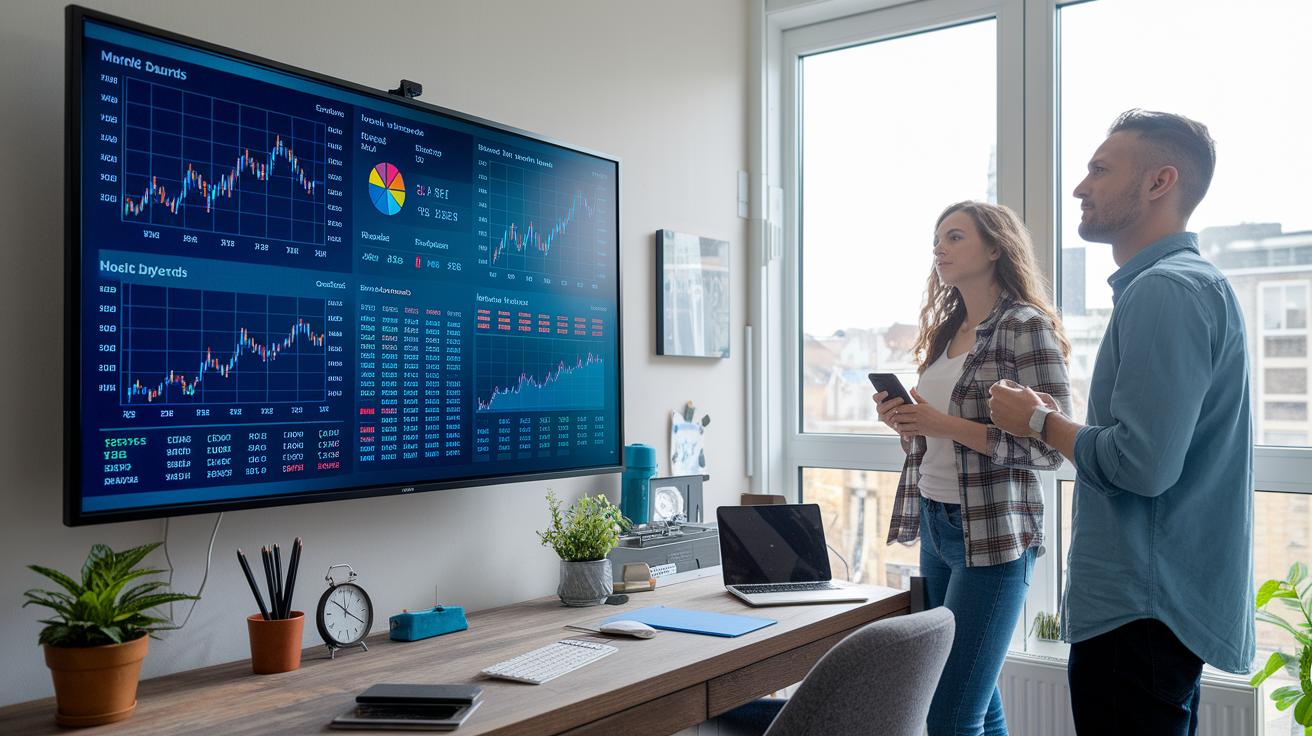
Imagine having a control room right on your screen that shows you what's happening in the market as it unfolds. These dashboards display clear charts, colorful heat maps, and easy-to-read tables that track your investments throughout the day. They give you a quick look at your portfolio so you can see when market changes might be pushing your risks past safe limits. And if things start to shift too much, automated alerts will pop up on your phone or email, acting like a friendly reminder that something needs your attention.
Each dashboard is designed to be flexible and precise. You can customize what you see, whether it's by asset class, region, or strategy, so you only focus on what matters most to you. Plus, when these dashboards are linked with your order management system, your setup can react in real time. Key features include:
| Feature | Description |
|---|---|
| Live P&L | Shows your current profit and loss in real time |
| Risk Heatmap | Uses colors to highlight areas where risk is high |
| Threshold Indicators | Signals when your risk levels are nearing preset limits |
| Tradeflow Monitor | Keeps an eye on the flow of trades in your portfolio |
| Alert Log | Records all notifications so you can review past alerts |
| Compliance Report | Ensures that all trading actions meet required guidelines |
When these dashboards work with other systems, they're not just about watching numbers, they can actually help manage your trades on the fly. When a risk alert goes off, your connected order system can quickly adjust your holdings. This smart link means your portfolio stays aligned with changing market conditions, giving you extra confidence every time you trade.
Case Studies in Real-Time Market Risk Monitoring Adoption
Every now and then, institutions take a fresh look at how they handle risk. Many are now moving to smart, real-time systems that watch market changes as they happen. These examples show just how helpful modern risk tools and automated alerts can be when planning and managing risk.
Take one major international bank, for example. They set up a new streaming platform that merged over 50 data feeds into one system. By trading old-fashioned batch processing for this real-time approach, they shrank their risk-reporting delay from hours to mere seconds. Imagine getting updates almost instantly when the market is choppy, it helped the bank keep their portfolios steady even during wild swings.
Then there’s an asset management firm that teamed up Java with a tool called GigaSpaces. With this setup, they could run 10,000 net present value calculations every minute across diverse portfolios. This high-speed processing meant they could tweak their risk levels on the fly. The result? More reliable management and greater openness that boosted investor trust, a clear win in today’s fast-moving market.
A specialized hedge fund also made big strides by using smart AI systems. These systems kept a continuous eye on market data to spot early warning signals. When the market shifted, the technology automatically rebalanced their positions. The hedge fund saw a 40% drop in excessive losses and improved their reporting speed by 30%. It’s like having a vigilant friend watching out for you during tough times.
In short, these real-life cases show how using fast data techniques and automated alerts can make a huge difference. By keeping a close eye on market changes in real time, institutions can lower their risk exposure and manage market ups and downs much more smoothly. Have you ever thought about how a quick update could change your approach when things get bumpy? These stories remind us that blending innovative tools with a clear game plan truly keeps risk management flexible and effective.
Real-Time Market Risk Monitoring: Boost Trade Confidence
New tech is making it easier for traders to stay ahead. Imagine having a system that checks risks in real time and instantly adjusts to market shifts – that’s what these modern tools do. They blend quick data crunching with secure sharing to create systems that are both clever and ready to react when you need them most.
- AI-driven orchestration
- Predictive volatility forecasting
- Secure data marketplaces
- GPU-accelerated analytics
- Alternative data integration
Think of these tools as parts of a well-rehearsed team. Advanced AI setups keep an eye on risk every minute, while models that use simple time-series forecasts can spot bumps in the market before they hit hard. And thanks to super-fast GPUs and smart databases, even the trickiest simulations run swiftly. By also mixing in extra information like satellite images, market sentiment, and ESG data (which tells you about a company’s environmental, social, and governance efforts), these systems give a complete picture of what might happen next. In short, traders can feel more relaxed knowing their systems respond instantly to any market change.
Final Words
In the action of using real-time market risk monitoring, financial strategies shift to immediate, hands-on decision-making. This approach weaves together data integration, live risk metrics, automated alerts, and intuitive dashboards to keep financial insights flowing.
Notice how moving from outdated batch methods to a vibrant, responsive setup adds confidence to money management. Every element contributes to a clearer path for smart financial choices, sparking optimism for a prosperous financial future.
FAQ
What is real-time risk monitoring?
Real-time risk monitoring means data is updated continuously to track market risk, enabling immediate alerts and swift decision-making when risk levels exceed safe thresholds.
What are market risk metrics?
Market risk metrics refer to measures like Value at Risk (VaR) and drawdown, which help quantify potential losses and indicate when adjustments to portfolios may be needed.
What is RTP in risk management?
RTP in risk management stands for real-time processing, ensuring that risk assessments are updated continuously to catch market changes and quickly notify managers of emerging issues.
How do modern institutions like JPMC or Chase manage market risk?
Modern institutions such as JPMC and Chase use live data streams, advanced analytics, and automated alerts to track exposures, allowing risk committees and analysts to act quickly.
How can one effectively monitor market risk?
Effective monitoring involves automated dashboards, continuous risk updates, and event-driven data streams that alert risk managers immediately when market conditions signal increased risk.